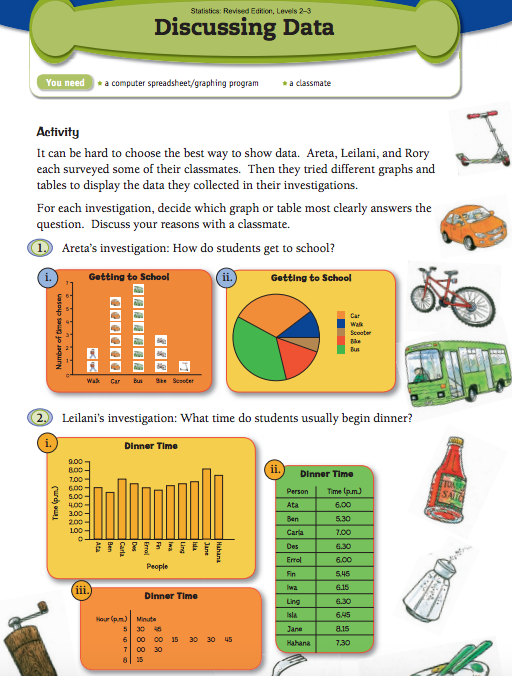
1. Two people walk 6 kids go in the car 7 kids go on the bus 3 kids bike and 1 goes on the scooters.
2. I think 8:15 and 7:30
1. There’s a bar graph , pie graph , tally chart
2. When you use a pie graph for how many girls or boys are in a class you don't know many girl or boys are in the class. A bar graph can see how many boy and girl are there from the numbers on the side.
3. Bar graph and tally chart
No comments:
Post a Comment
Note: only a member of this blog may post a comment.